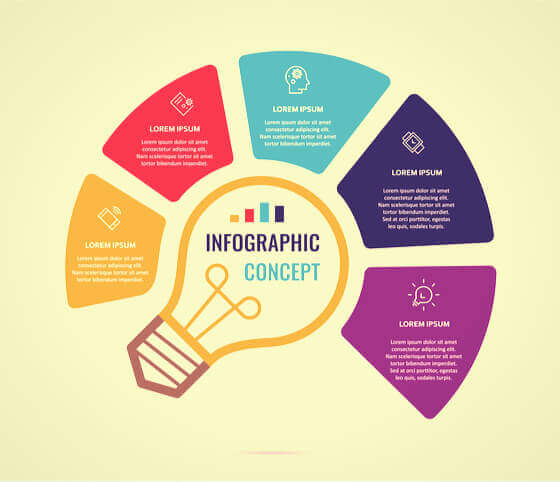
Content creation is not only about the creation of articles with a certain number of keywords – the visual depiction of your content plays an important role as well. The disposal of images and texts, clear infographics and structurizing icons contribute to the arousal of attention from search engines and users. Infographics can never replace informative texts and keyword structures, but they serve the purpose of visualizing and summarizing knowledge from your blogs and articles.
How to create valuable infographics
- Creating uniform and topical templates (colors, designs, icons).
- Content Customization (summarizing important information).
- File upload and management (file names, tags, code embedding.
Types of infographics and how to use them
With creator tools like Visme you can easily create different infographics for different purposes.
Frequently used infographic types
- Listing infographics (service offers, list of benefits for products, etc.)
- Comparing infographics (pro and contra lists, product comparison etc.)
- Timeline infographics (business history, historical developments etc.)
- Informative infographics (summarizing complex contents and arguments)
- Anatomical infographics (visual representation of biological or chemical processes)
- Statistical infographics (representation of statistics and proportions)
- Local infographics (maps, instructions on how to reach destinations etc.)